
Understand How Fans Actually Move — From Entry to Seat
CrowdIQ’s Crowd Flow tracking gives you a clear lens into how fans move throughout your venue — from gates to seats to gathering points — helping you optimize staffing, signage, and the fan journey.
Request a DemoFragmented Data ≠ Full Fan Journey
Traditional gate scans and in venue purchases only capture part of the story. CrowdIQ fills the gaps — connecting the full fan movement from entrance to exit, seat to concourse.
How Crowd Flow Tracking Works
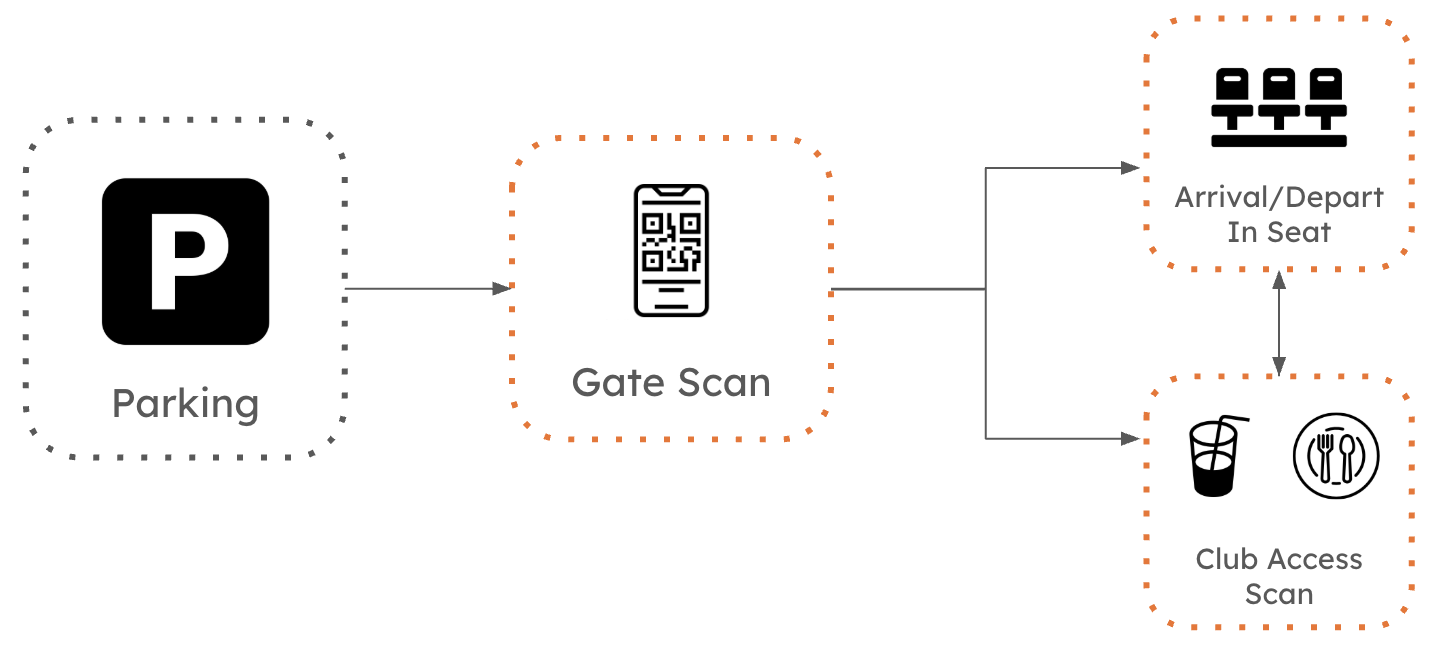
Track fan movement from gate scan to seat, club entry, and key touchpoints throughout the event.
Beyond Movement: Know Who’s in the Seat
CrowdIQ captures not just how fans move — but when and where they’re truly present. That means deeper insight into seat occupancy across the venue.
Seating Consistency
See which sections stay filled during key moments — and which fans leave early or linger long after halftime.
Asset Alignment
Correlate fan presence with sponsor visibility zones and media-facing inventory to prove real impact.
Loyalty Patterns
Identify your most reliable fans by measuring return visits, section stickiness, and dwell behavior over time.
These insights can be layered with CrowdIQ’s attention, demographic, and behavioral data to build a complete picture of fan engagement.
Key Use Cases & Operational Wins
- Path of Travel: Identify the most common routes fans take
- Concession Overlay: Optimize stand placement & dwell zones
- Gate Staffing: Adjust staffing schedules based on peak entry
- Section-by-Section Analysis: Detect high-congestion areas
- Club Access Monitoring: Measure time spent in premium zones
- Ingress/Egress Planning: Predict crowd exit patterns
What You Gain
Revenue Outcomes
- Boost per-cap spend by repositioning concessions
- Monetize dwell-heavy zones with new SRO offers
- Reduce staffing waste and reallocate for key moments
Fan Experience Outcomes
- Shorter lines at entry, food, and restrooms
- Improved wayfinding & signage based on flow
- Smoother seat-to-concourse transitions for all fans
Bring Crowd Flow into Your Ops Playbook
Book a demo to explore how CrowdIQ’s seat-level flow tracking can unlock better venue decisions, smoother fan journeys, and stronger revenue.
Request a Demo